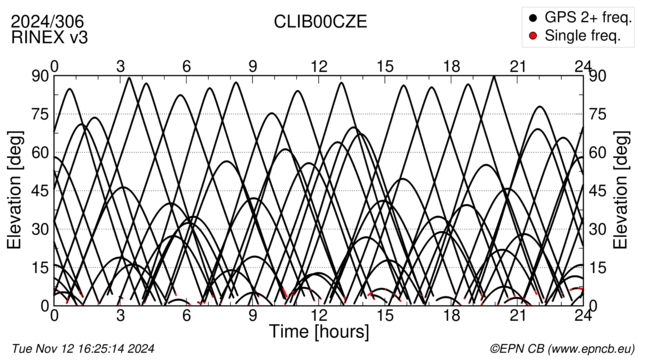
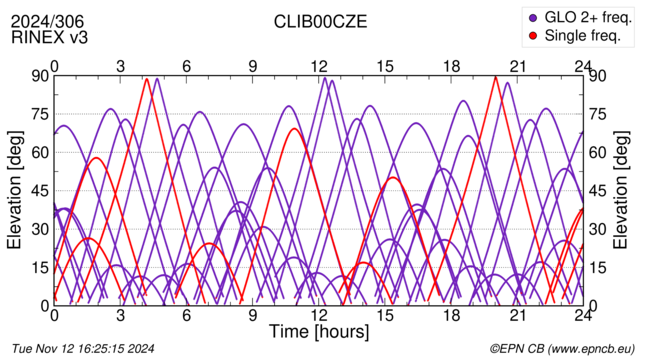
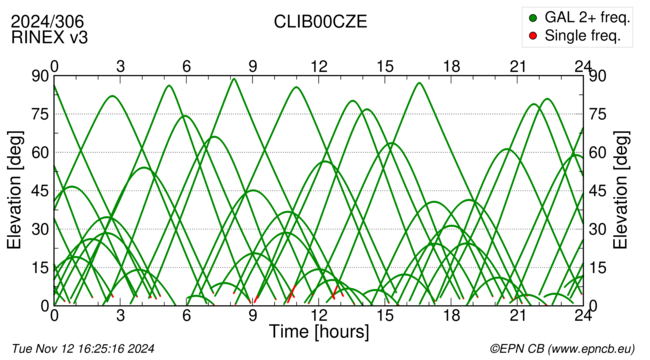
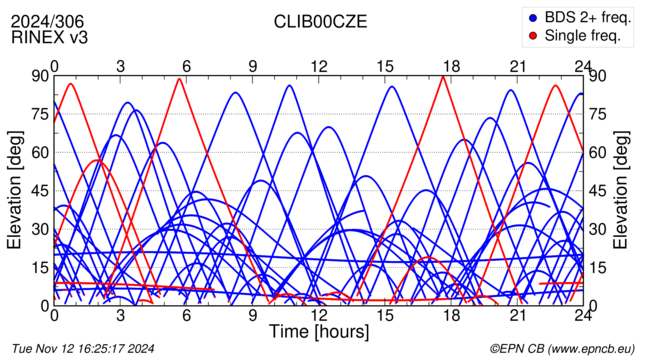
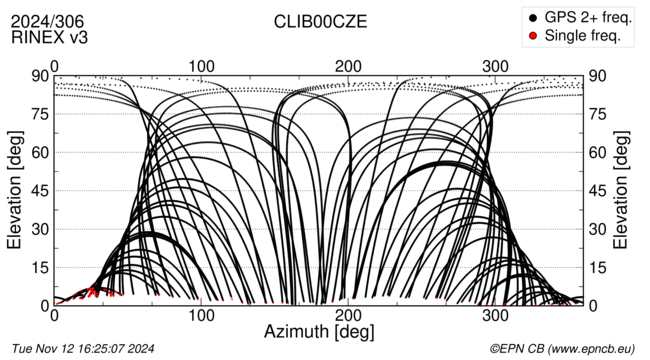
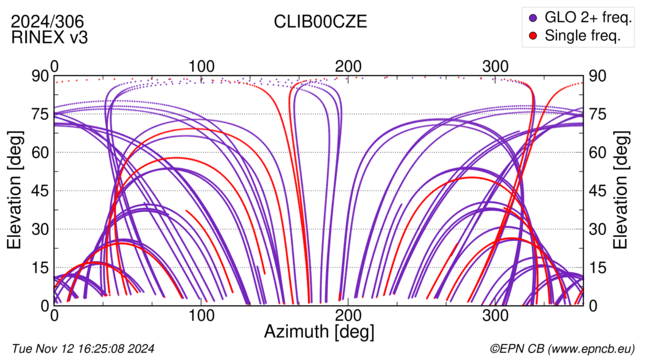
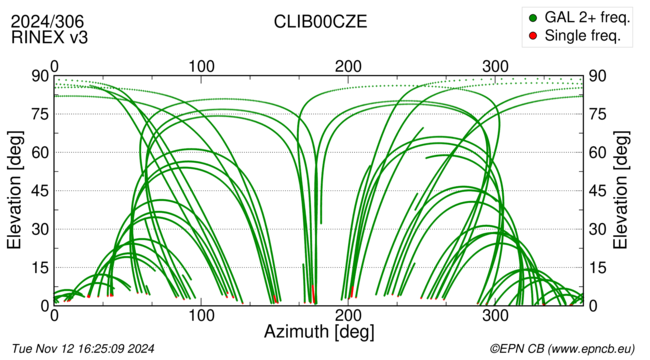
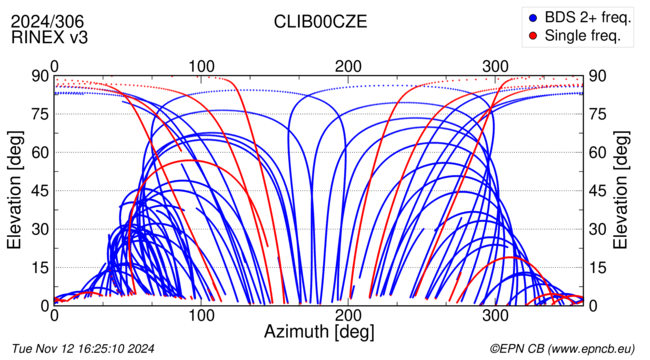
Select a station:
(Select a Station)
ACOR00ESP (A Coruna,ESP) [ RNX3 ]
ADAR00GBR (Aberdaron,GBR) [ RNX3 ]
AGRN00ITA (Agrigento,ITA) [ RNX3 ]
AJAC00FRA (Ajaccio,FRA) [ RNX3 ]
ALAC00ESP (Alicante,ESP) [ RNX3 ]
ALBA00ESP (Albacete,ESP) [ RNX3 ]
ALCI00UKR (Alchevsk/Mikhailovka,UKR) [ ] [Former]
ALKS00LVA (Aluksne,LVA) [ RNX3 ] [Proposed]
ALME00ESP (Almeria,ESP) [ RNX3 ]
AMMN00JOR (Amman,JOR) [ ] [Former]
ANK200TUR (Ankara,TUR) [ RNX3 ]
ANKR00TUR (Ankara,TUR) [ ] [Former]
AQUI00ITA (L'Aquila,ITA) [ RNX3 ]
ARA200SVN (Areh,SVN) [ RNX3 ]
ARGI00FRO (Argir, Torshavn,FRO) [ RNX3 ]
ARIS00GBR (Arisaig,GBR) [ RNX3 ]
ARJ600SWE (Arjeplog,SWE) [ RNX3 ]
ASGA00CYP (Asgata,CYP) [ RNX3 ] [Proposed]
ASIR00ITA (Roma,ITA) [ RNX3 ]
AUBG00DEU (Augsburg,DEU) [ RNX3 ]
AUT100GRC (Thessaloniki,GRC) [ RNX3 ]
AUTN00FRA (Autun,FRA) [ RNX3 ]
AXPV00FRA (Aix En Provence,FRA) [ RNX3 ]
BACA00ROU (Bacau,ROU) [ RNX3 ]
BADH00DEU (Bad Homburg,DEU) [ RNX3 ]
BAIA00ROU (Baia Mare,ROU) [ RNX3 ]
BAUT00DEU (Bautzen,DEU) [ RNX3 ]
BBYS00SVK (Banska Bystrica,SVK) [ RNX3 ]
BCLN00ESP (Sant Vicenc dels Horts,ESP) [ RNX3 ]
BELF00GBR (Belfast,GBR) [ ] [Former]
BELL00ESP (Bellmunt de Segarra,ESP) [ RNX3 ]
BFST00GBR (Belfast,GBR) [ ] [Proposed]
BIRG00ITA (Trapani,ITA) [ RNX3 ]
BISK00CZE (Zlate Hory,CZE) [ ]
BME100HUN (Budapest,HUN) [ RNX3 ]
BOGE00POL (Borowa Gora,POL) [ RNX3 ]
BOGI00POL (Borowa Gora,POL) [ RNX3 ]
BOGO00POL (Borowa Gora,POL) [ RNX3 ]
BOLG00ITA (Bologna,ITA) [ RNX3 ]
BOR100POL (Borowiec,POL) [ RNX3 ]
BORJ00DEU (Borkum (Island of Borkum),DEU) [ RNX3 ]
BORK00DEU (Borkum,DEU) [ ] [Former]
BORR00ESP (Borriana,ESP) [ RNX3 ]
BPDL00POL (Biala Podlaska,POL) [ RNX3 ]
BRMF00FRA (Bron,FRA) [ RNX3 ]
BRMG00DEU (Bremgarten,DEU) [ RNX3 ]
BRON00FRA (Bron,FRA) [ ] [Former]
BRST00FRA (Brest,FRA) [ RNX3 ]
BRTS00BLR (Brest,BLR) [ RNX3 ]
BRUS00BEL (Brussels,BEL) [ ] [Former]
BRUX00BEL (Brussels,BEL) [ RNX3 ]
BSCN00FRA (Besançon,FRA) [ RNX3 ]
BSVZ00ITA (Basovizza,ITA) [ RNX3 ]
BUCU00ROU (Bucuresti,ROU) [ RNX3 ]
BUDD00DNK (Copenhagen,DNK) [ RNX3 ]
BUDP00DNK (Kobenhavn,DNK) [ RNX3 ]
BUTE00HUN (Budapest,HUN) [ RNX3 ]
BYDG00POL (Bydgoszcz,POL) [ RNX3 ]
BZR200ITA (Bolzano Bozen,ITA) [ RNX3 ]
BZRG00ITA (Bolzano - Bozen,ITA) [ ] [Former]
CACE00ESP (Caceres,ESP) [ RNX3 ]
CAEN00FRA (Caen,FRA) [ ] [Former]
CAG100ITA (Cagliari,ITA) [ RNX3 ]
CAGL00ITA (Cagliari,ITA) [ ] [Former]
CAGZ00ITA (Capoterra,ITA) [ ] [Former]
CAKO00HRV (Cakovec,HRV) [ RNX3 ]
CAME00ITA (Camerino -Rocca Di Varano-,ITA) [ ] [Former]
CANT00ESP (Santander,ESP) [ RNX3 ]
CARG00ESP (Cartagena,ESP) [ RNX3 ]
CASB00IRL (CastleBar,IRL) [ ] [Former]
CASC00PRT (Cascais,PRT) [ RNX3 ]
CASE00ESP (Cassa de la Selva,ESP) [ RNX3 ]
CEBR00ESP (Cebreros,ESP) [ RNX3 ]
CEU100ESP (Ceuta,ESP) [ RNX3 ]
CEUT00ESP (Ceuta,ESP) [ ] [Former]
CFRM00CZE (Frydek Mistek,CZE) [ RNX3 ]
CHIO00GBR (Chilbolton,GBR) [ RNX3 ]
CHIZ00FRA (Chize,FRA) [ RNX3 ]
CIMO00ITA (Modena,ITA) [ RNX3 ]
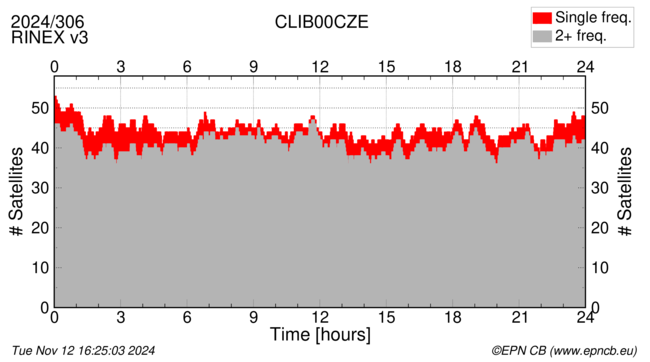
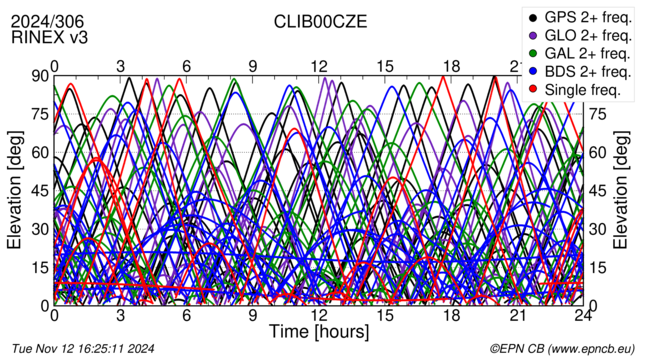
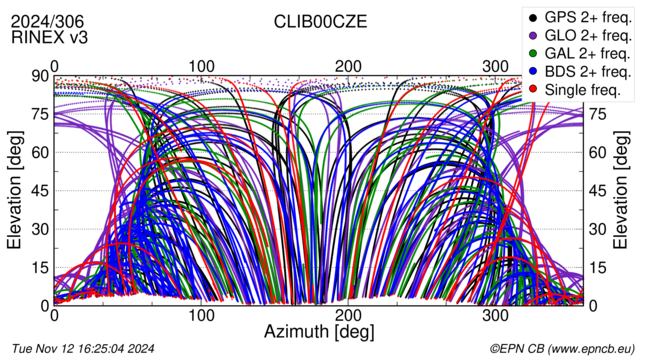
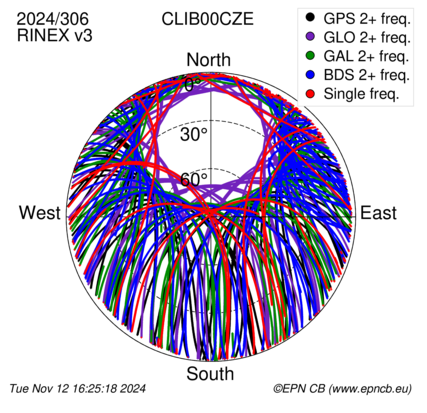
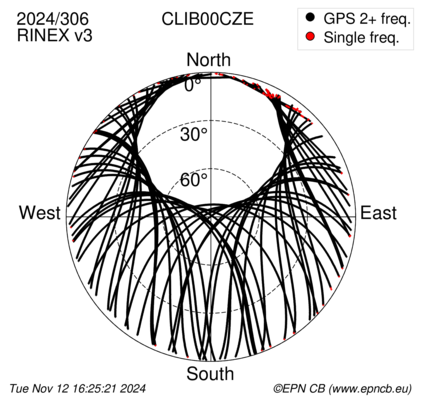
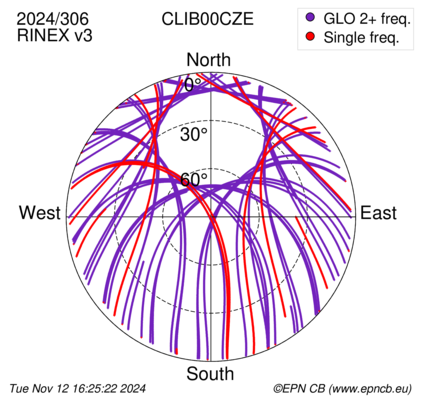
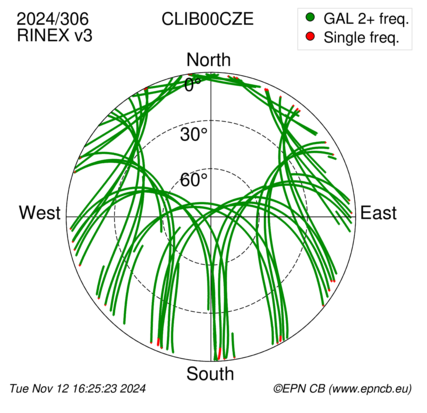
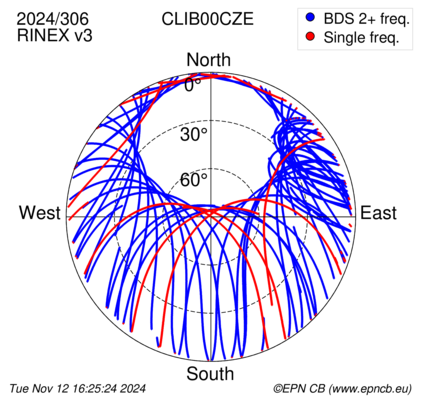
CLIB00CZE (Liberec,CZE) [ RNX3 ]
CMEL00ITA (Capo Mele,ITA) [ RNX3 ]
CNIV00UKR (Chernihiv,UKR) [ ]
COBA00ESP (Cordoba,ESP) [ RNX3 ]
COMO00ITA (Como,ITA) [ RNX3 ]
COST00ROU (Constanta,ROU) [ RNX3 ]
CPAR00CZE (Pardubice,CZE) [ RNX3 ]
CRAK00CZE (Rakovnik,CZE) [ RNX3 ]
CREI00FRA (Creil,FRA) [ ] [Former]
CREU00ESP (Cadaques,ESP) [ RNX3 ]
CTAB00CZE (Tabor,CZE) [ RNX3 ]
CUGA00ITA (Uri,ITA) [ RNX3 ]
DARE00GBR (Daresbury,GBR) [ RNX3 ]
DELF00NLD (Delft,NLD) [ RNX3 ]
DENT00BEL (Dentergem,BEL) [ RNX3 ]
DEVA00ROU (Deva,ROU) [ RNX3 ]
DGOR00MNE (Podgorica,MNE) [ RNX3 ]
DIEP00DEU (Diepholz,DEU) [ RNX3 ]
DILL00DEU (Dillingen,DEU) [ RNX3 ]
DLF100NLD (Delft,NLD) [ RNX3 ]
DLKS00LVA (Daugavpils,LVA) [ RNX3 ] [Proposed]
DNMU00UKR (Dnipro,UKR) [ RNX3 ]
DOUR00BEL (Dourbes,BEL) [ RNX3 ]
DRAG00ISR (Metzoki dragot,ISR) [ RNX2 ]
DRES00DEU (Dresden,DEU) [ ] [Former]
DUB200HRV (Dubrovnik,HRV) [ RNX3 ]
DUBR00HRV (Dubrovnik,HRV) [ ] [Former]
DUTH00GRC (Xanthi,GRC) [ RNX3 ]
DVCN00SVK (Devicany,SVK) [ RNX3 ]
DYNG00GRC (DIONYSOS,GRC) [ RNX3 ]
EBRE00ESP (Roquetes,ESP) [ RNX3 ]
EDIN00GBR (Edinburgh,GBR) [ ] [Former]
EGLT00FRA (Egletons,FRA) [ RNX3 ]
EIJS00NLD (Eijsden,NLD) [ RNX3 ]
EKAR00ITA (Asiago,ITA) [ RNX3 ]
ELBA00ITA (San Piero Campo Nell'Elba - Elba,ITA) [ RNX3 ]
ENAO00PRT (Santa Cruz da Graciosa,PRT) [ RNX3 ]
ENIS00GBR (Enniskillen,GBR) [ ]
ENTZ00FRA (Entzheim,FRA) [ RNX3 ]
ENZA00ITA (Piacenza,ITA) [ RNX3 ]
ESCO00ESP (Naut Aran,ESP) [ RNX3 ]
EUSK00DEU (Euskirchen,DEU) [ RNX3 ]
EVPA00UKR (Evpatoria,UKR) [ ] [Former]
FATA00ITA (Taranto,ITA) [ ] [Former]
FFMJ00DEU (Frankfurt / Main,DEU) [ RNX3 ]
FINS00FIN (Finstrom,FIN) [ RNX3 ]
FLRS00PRT (Santa Cruz das Flores,PRT) [ RNX3 ]
FOYL00GBR (Londonderry,GBR) [ ]
FRA200UKR (Ivano-Frankivsk,UKR) [ RNX3 ]
FRNE00ITA (Frosinone,ITA) [ RNX3 ]
FUNC00PRT (Funchal,PRT) [ RNX3 ]
GAIA00PRT (Gaia,PRT) [ RNX3 ]
GALH00ITA (Isnello,ITA) [ RNX3 ]
GANP00SVK (Ganovce - Poprad,SVK) [ RNX3 ]
GARI00ITA (Porto Garibaldi,ITA) [ RNX3 ]
GDRS00UKR (Gorodok,UKR) [ RNX2 ] [Former]
GELL00DEU (Gellin,DEU) [ RNX3 ]
GENO00ITA (Genova,ITA) [ RNX3 ]
GJML00SRB (Gornji Milanovac,SRB) [ RNX3 ]
GLSV00UKR (Kiev,UKR) [ RNX3 ]
GOET00DEU (Goettingen,DEU) [ RNX3 ]
GOML00BLR (Gomel,BLR) [ RNX3 ]
GOP600CZE (Ondrejov,CZE) [ ]
GOPE00CZE (Ondrejov,CZE) [ RNX3 ]
GOR200DEU (Gorleben,DEU) [ RNX3 ]
GRAC00FRA (Caussols,FRA) [ RNX3 ]
GRAS00FRA (Caussols,FRA) [ RNX3 ]
GRAZ00AUT (Graz,AUT) [ RNX3 ]
GSR100SVN (Ljubljana,SVN) [ RNX3 ]
GUIP00FRA (Guipavas,FRA) [ RNX3 ]
GVDG00GRC (Gavdos Island,GRC) [ RNX3 ]
GVNL00ITA (Leonessa,ITA) [ RNX3 ] [Proposed]
GWWL00POL (Gorzow Wielkopolski,POL) [ RNX3 ]
HAS600SWE (Hassleholm,SWE) [ RNX3 ]
HEL200DEU (Helgoland Island,DEU) [ RNX3 ]
HELG00DEU (Helgoland Island,DEU) [ RNX3 ]
HERS00GBR (Hailsham,GBR) [ RNX3 ]
HERT00GBR (Hailsham,GBR) [ RNX3 ]
HETT00FIN (Hetta,FIN) [ RNX3 ]
HFL200AUT (Innsbruck,AUT) [ ] [Former]
HFLK00AUT (Innsbruck,AUT) [ ] [Former]
HOBU00DEU (Hohenbuenstorf, Eschenberg,DEU) [ RNX3 ]
HOE200DEU (Hoernum / Island Sylt,DEU) [ ] [Former]
HOER00DEU (Hoernum / Island Sylt,DEU) [ ] [Former]
HOFJ00DEU (Hof,DEU) [ RNX3 ]
HOFN00ISL (Hoefn,ISL) [ RNX3 ]
HUEL00ESP (Huelva,ESP) [ RNX3 ]
IAVH00MAR (Rabat,MAR) [ ] [Former]
IBIZ00ESP (Ibiza,ESP) [ RNX3 ]
IENG00ITA (Torino,ITA) [ RNX3 ]
IGD100GRC (Athens,GRC) [ ] [Former]
IGEO00MDA (Chisinau,MDA) [ RNX3 ]
IGM200ITA (Firenze,ITA) [ RNX3 ]
IGMI00ITA (Firenze,ITA) [ RNX3 ]
IGNF00FRA (Saint-Mande,FRA) [ RNX3 ]
IJMU00NLD (Ijmuiden,NLD) [ RNX3 ]
ILDX00FRA (Ile d'Aix,FRA) [ RNX3 ]
INVE00GBR (Inverness,GBR) [ ] [Former]
INVR00GBR (Inverness,GBR) [ RNX3 ]
IRBE00LVA (Irbene,LVA) [ RNX3 ]
ISRN00ITA (Isernia,ITA) [ RNX3 ]
ISTA00TUR (Istanbul,TUR) [ RNX3 ]
IZAN00ESP (Guimar,ESP) [ RNX3 ]
IZMI00TUR (izmir,TUR) [ RNX3 ]
IZRS00UKR (Izmail,UKR) [ ] [Former]
JATE00ITA (Jacotenente,ITA) [ RNX3 ]
JOE200FIN (Joensuu,FIN) [ RNX3 ]
JOEN00FIN (Joensuu,FIN) [ RNX3 ]
JON600SWE (Jonkoping,SWE) [ RNX3 ]
JOZ200POL (Jozefoslaw,POL) [ RNX3 ]
JOZE00POL (Jozefoslaw,POL) [ RNX3 ]
KAD600SWE (Karlstad,SWE) [ RNX3 ]
KARL00DEU (Karlsruhe,DEU) [ RNX3 ]
KATO00POL (Katowice,POL) [ RNX3 ]
KDA200SVN (Korada,SVN) [ RNX3 ]
KELY00GRL (Kangerlussuaq,GRL) [ ] [Former]
KEV200FIN (Utsjoki,FIN) [ RNX3 ]
KHAR00UKR (Kharkiv,UKR) [ ]
KILP00FIN (Kilpisjarvi,FIN) [ RNX3 ]
KIR000SWE (Kiruna,SWE) [ RNX3 ]
KIR800SWE (Kiruna,SWE) [ RNX3 ]
KIRU00SWE (Kiruna,SWE) [ RNX3 ]
KIV200FIN (Aanekoski,FIN) [ RNX3 ]
KLAD00SRB (Kladovo,SRB) [ RNX3 ]
KLNK00BLR (Kalinkovichi,BLR) [ RNX3 ]
KLOP00DEU (Kloppenheim / Frankfurt,DEU) [ RNX3 ]
KLSQ00GRL (Kangerlussuaq,GRL) [ RNX3 ]
KNJA00SRB (Knjazevac,SRB) [ RNX3 ]
KOS100NLD (Kootwijk,NLD) [ RNX3 ]
KOSG00NLD (Kootwijk,NLD) [ ] [Former]
KRA100POL (Krakow,POL) [ RNX3 ]
KRAW00POL (Krakow,POL) [ RNX3 ]
KRRS00UKR (Kropyvnytsky,UKR) [ RNX2 RNX3 ]
KRS100TUR (Kars,TUR) [ RNX3 ]
KTVL00UKR (Katzively, Greater Yalta,UKR) [ RNX2 ]
KUNZ00CZE (Kunzak,CZE) [ RNX3 ]
KURE00EST (Kuressaare,EST) [ RNX3 ]
KUU200FIN (Kuusamo,FIN) [ RNX3 ]
LAGO00PRT (Lagos,PRT) [ RNX3 ]
LAMA00POL (Olsztyn,POL) [ RNX3 ]
LAMP00ITA (Lampedusa,ITA) [ RNX3 ]
LARM00GRC (Larisa,GRC) [ RNX3 ]
LCRA00ITA (Lucera,ITA) [ RNX3 ]
LDB200DEU (Lindenberg,DEU) [ RNX3 ]
LEIJ00DEU (Leipzig,DEU) [ RNX3 ]
LEK600SWE (Leksand,SWE) [ RNX3 ]
LEON00ESP (Leon,ESP) [ RNX3 ]
LERI00GBR (Lerwick,GBR) [ RNX3 ]
LESK00SRB (Leskovac,SRB) [ RNX3 ]
LICC00GBR (London,GBR) [ RNX3 ]
LIDA00BLR (Lida,BLR) [ RNX3 ]
LIGN00ITA (Lignan,ITA) [ RNX3 ]
LIL200FRA (Lille,FRA) [ RNX3 ]
LILL00FRA (Villeneuve d'Ascq,FRA) [ ] [Former]
LINZ00AUT (Linz,AUT) [ RNX3 ]
LLIV00ESP (Llivia,ESP) [ RNX3 ]
LODZ00POL (Lodz,POL) [ RNX3 ]
LOV600SWE (Lovo,SWE) [ RNX3 ]
LPAL00ESP (Roque de los Muchachos,ESP) [ RNX3 ]
LROC00FRA (La Rochelle,FRA) [ RNX3 ]
M0SE00ITA (Roma,ITA) [ RNX3 ]
MAD200ESP (Robledo,ESP) [ RNX2 ]
MADR00ESP (Robledo,ESP) [ RNX3 ]
MAH100IRL (Mace Head,IRL) [ RNX3 ]
MALA00ESP (Malaga,ESP) [ RNX3 ]
MALL00ESP (Palma de Mallorca,ESP) [ RNX3 ]
MAN200FRA (Le Mans,FRA) [ RNX3 ]
MANS00FRA (Le Mans,FRA) [ ] [Former]
MAR600SWE (Maartsbo,SWE) [ RNX3 ]
MAR700SWE (Gavle,SWE) [ RNX3 ]
MARJ00CZE (Jachymov,CZE) [ ] [Former]
MARP00UKR (Mariupol,UKR) [ ]
MARS00FRA (Marseille,FRA) [ RNX3 ]
MAS100ESP (Maspalomas,ESP) [ RNX3 ]
MAT100ITA (MATERA,ITA) [ RNX3 ]
MATE00ITA (Matera,ITA) [ RNX3 ]
MATG00ITA (Matera,ITA) [ RNX3 ]
MDEU00ITA (Tempio Pausania,ITA) [ RNX3 ]
MDOR00FRA (Saint-Didier-au-Mont-d'Or,FRA) [ ] [Former]
MDVJ00RUS (Mendeleevo,RUS) [ RNX2 RNX3 ]
MDVO00RUS (Mendeleevo,RUS) [ ] [Former]
MEDI00ITA (Medicina,ITA) [ RNX3 ]
MELI00ESP (Melilla,ESP) [ RNX3 ]
MERS00TUR (Erdemli,TUR) [ RNX3 ]
MET300FIN (Kirkkonummi,FIN) [ RNX3 ]
METG00FIN (METSAHOVI,FIN) [ RNX3 ]
METS00FIN (Kirkkonummi,FIN) [ RNX3 ] [Former]
MIK300FIN (Mikkeli,FIN) [ RNX3 ]
MIKL00UKR (Mykolaiv,UKR) [ RNX3 ]
MILO00ITA (Trapani - Milo,ITA) [ ] [Former]
MKRS00UKR (Mukachevo,UKR) [ RNX2 ]
MLHD00IRL (Malin Head,IRL) [ RNX3 ]
MLVL00FRA (Marne-la-Vallee,FRA) [ RNX3 ]
MMET00ITA (Metaponto,ITA) [ RNX3 ]
MNKW00BLR (Minsk,BLR) [ RNX3 ]
MNSK00BLR (Minsk,BLR) [ RNX3 ]
MOGI00BLR (Mogilev,BLR) [ RNX3 ]
MOP200SVK (Modra-Piesok,SVK) [ RNX3 ]
MOPI00SVK (Modra-Piesok,SVK) [ RNX3 ]
MOPS00ITA (Modena,ITA) [ RNX3 ]
MORP00GBR (Morpeth,GBR) [ RNX2 ]
MSEL00ITA (Medicina,ITA) [ RNX3 ]
MUK200UKR (Mukachevo,UKR) [ RNX3 ]
NABG00NOR (Ny-Alesund,NOR) [ RNX3 ]
NEWL00GBR (Newlyn,GBR) [ ] [Former]
NICO00CYP (Nicosia,CYP) [ RNX3 ]
NOA100GRC (Athens,GRC) [ RNX3 ]
NOR700SWE (Norrkoping,SWE) [ RNX3 ]
NOT100ITA (Noto,ITA) [ RNX3 ]
NOTO00ITA (Noto,ITA) [ ] [Former]
NOVP00BLR (Novopolotsk,BLR) [ RNX3 ]
NPAZ00SRB (Novi Pazar,SRB) [ RNX3 ]
NPLD00GBR (Teddington,GBR) [ ] [Former]
NSSP00ARM (Yerevan,ARM) [ ] [Former]
NYA100NOR (Ny-Alesund,NOR) [ RNX3 ]
NYA200NOR (Ny Alesund,NOR) [ RNX3 ]
NYAL00NOR (Ny-Alesund,NOR) [ RNX3 ]
NYIR00HUN (Nyirbator,HUN) [ ] [Former]
OBE200DEU (Oberpfaffenhofen,DEU) [ ] [Former]
OBE400DEU (Oberpfaffenhofen,DEU) [ RNX3 ]
OBER00DEU (Oberpfaffenhofen,DEU) [ ] [Former]
OBET00DEU (Wessling,DEU) [ ] [Former]
OLK200FIN (Rauma,FIN) [ RNX3 ]
ONS100SWE (Onsala,SWE) [ RNX3 ]
ONSA00SWE (Onsala,SWE) [ RNX3 ]
ORID00MKD (Ohrid,MKD) [ RNX3 ]
ORIV00FIN (Orivesi,FIN) [ RNX3 ]
OROS00HUN (Oroshaza,HUN) [ RNX3 ]
ORTE00ITA (Orte, Viterbo,ITA) [ RNX3 ]
OSJE00HRV (Osijek,HRV) [ ] [Former]
OSK600SWE (Oskarshamn,SWE) [ RNX3 ]
OSLO00NOR (Oslo,NOR) [ ] [Former]
OSLS00NOR (Oslo,NOR) [ RNX3 ]
OST600SWE (Ostersund,SWE) [ RNX3 ]
OUL200FIN (Oulu,FIN) [ RNX3 ]
OVE600SWE (Overkalix,SWE) [ RNX3 ]
PADO00ITA (Padova,ITA) [ RNX3 ]
PALB00ITA (Palese,ITA) [ RNX3 ]
PASA00ESP (Pasaia,ESP) [ RNX3 ]
PAT000GRC (Patras,GRC) [ RNX2 ]
PDEL00PRT (Ponta Delgada,PRT) [ RNX3 ]
PEN200HUN (Penc,HUN) [ ] [Former]
PENC00HUN (Penc,HUN) [ RNX3 ]
PFA200AUT (Bregenz,AUT) [ ] [Former]
PFA300AUT (Bregenz,AUT) [ RNX3 ]
PFAN00AUT (Bregenz,AUT) [ ] [Former]
PINS00BLR (Pinsk,BLR) [ RNX3 ]
PLND00SRB (Plandiste,SRB) [ ] [Former]
PLYM00GBR (Plymouth,GBR) [ ] [Former]
PMTH00GBR (Plymouth,GBR) [ RNX3 ]
POLV00UKR (Poltava,UKR) [ RNX3 ]
POPI00ITA (Potenza Picena,ITA) [ RNX3 ]
PORE00HRV (Porec,HRV) [ RNX3 ]
POTS00DEU (Potsdam,DEU) [ RNX3 ]
POUS00CZE (Poustka,CZE) [ ]
POZE00HRV (Pozega,HRV) [ RNX3 ]
PPSH00NOR (Polish Polar Station, Hornsund,NOR) [ RNX3 ]
PRAT00ITA (Prato,ITA) [ RNX3 ]
PRIJ00SRB (Prijepolje,SRB) [ RNX3 ]
PRYL00UKR (Pryluky,UKR) [ RNX3 ]
PSTO00PRT (Porto Santo,PRT) [ RNX3 ]
PSTV00BLR (Postavy,BLR) [ RNX3 ]
PTBB00DEU (Braunschweig,DEU) [ RNX3 ]
PULA00HRV (Pula,HRV) [ ] [Former]
PULK00RUS (ST.PETERSBURG,RUS) [ RNX3 ]
PUYV00FRA (Le Puy en Velay,FRA) [ RNX3 ]
PYHA00FIN (Pyhajoki,FIN) [ RNX3 ]
PZA200SVN (Prilozje,SVN) [ RNX3 ]
QAQ100GRL (Qaqortoq / Julianehaab,GRL) [ RNX3 ]
RABT00MAR (Rabat,MAR) [ RNX3 ]
RAEG00PRT (Vila do Porto,PRT) [ RNX3 ]
RAH100UKR (Rakhiv,UKR) [ RNX3 ]
RAMO00ISR (Mitzpe Ramon,ISR) [ RNX2 ]
RANT00DEU (Rantum / Island Sylt,DEU) [ RNX3 ]
REDU00BEL (Redu,BEL) [ RNX3 ]
REDZ00POL (Redzikowo,POL) [ RNX3 ]
REYK00ISL (Reykjavik,ISL) [ RNX3 ]
RIGA00LVA (Riga,LVA) [ RNX3 ]
RIO100ESP (Logrono,ESP) [ RNX3 ]
RIOJ00ESP (Logrono,ESP) [ ] [Former]
RIVO00ITA (Rivolto (Codroipo),ITA) [ RNX3 ]
ROM200FIN (Kuhmo,FIN) [ RNX3 ]
ROVE00ITA (Rovereto,ITA) [ ]
RVNE00UKR (Rivne,UKR) [ RNX3 ]
SABA00SRB (Sabac,SRB) [ RNX3 ]
SALA00ESP (Salamanca,ESP) [ RNX3 ]
SART00ITA (Pranusanguni San Basilio,ITA) [ RNX3 ]
SAS200DEU (Sassnitz Island of Ruegen,DEU) [ RNX3 ]
SASS00DEU (Sassnitz Island of Ruegen,DEU) [ ] [Former]
SAVU00FIN (Savukoski,FIN) [ RNX3 ]
SBG200AUT (Salzburg,AUT) [ RNX3 ]
SBGZ00AUT (Salzburg,AUT) [ ] [Former]
SCIL00GBR (Hugh Town,GBR) [ RNX3 ]
SCOA00FRA (Ciboure,FRA) [ RNX3 ]
SCOR00GRL (Scoresbysund/Ittoqqoormiit,GRL) [ RNX3 ]
SFER00ESP (San Fernando,ESP) [ ]
SHOE00GBR (Shoeburyness,GBR) [ RNX3 ]
SID000SRB (Sid,SRB) [ RNX3 ]
SJDV00FRA (Saint Jean des Vignes,FRA) [ ]
SKE000SWE (Skellefteaa,SWE) [ RNX3 ]
SKE800SWE (Skellefteaa,SWE) [ RNX3 ]
SMI200DNK (Smidstrup, Vejle,DNK) [ ] [Former]
SMID00DNK (Smidstrup, Vejle,DNK) [ ] [Former]
SMLA00UKR (Smila,UKR) [ RNX3 ]
SMNE00FRA (Saint-Mandé,FRA) [ ] [Former]
SNEC00CZE (Pec (Pod Snezkou),CZE) [ ] [Former]
SNEO00GBR (St Neots,GBR) [ RNX3 ]
SNIK00ITA (BARI,ITA) [ RNX3 ]
SOD300FIN (Sodankyla,FIN) [ RNX3 ]
SODA00FIN (Sodankyla,FIN) [ RNX3 ]
SOFI00BGR (Sofia,BGR) [ RNX3 ]
SONS00ESP (Sonseca,ESP) [ RNX3 ]
SPRN00HUN (Sopron,HUN) [ RNX3 ]
SPT000SWE (Boras,SWE) [ RNX3 ]
SPT700SWE (Borås,SWE) [ RNX3 ]
SRJV00BIH (Sarajevo,BIH) [ RNX3 ]
STAS00NOR (Stavanger,NOR) [ RNX3 ]
STAV00NOR (Stavanger,NOR) [ ] [Former]
STNB00PRT (Santana,PRT) [ RNX3 ]
SUBO00SRB (Subotica,SRB) [ RNX3 ]
SUL500DNK (Suldrup,DNK) [ RNX3 ]
SULD00DNK (Suldrup,DNK) [ RNX3 ]
SULP00UKR (Lviv,UKR) [ RNX3 ]
SUN600SWE (Sundsvall,SWE) [ RNX3 ]
SUR400EST (Suurupi,EST) [ RNX3 ]
SUUR00EST (Suurupi,EST) [ ] [Former]
SVE600SWE (Sveg,SWE) [ RNX3 ]
SVLL00ITA (Savelli,ITA) [ RNX3 ]
SVTL00RUS (Svetloe,RUS) [ RNX3 ]
SWAS00GBR (Swansea,GBR) [ RNX3 ]
SWKI00POL (Suwalki,POL) [ RNX3 ]
TAR000ESP (Tarifa,ESP) [ RNX3 ]
TARI00ESP (Tarifa,ESP) [ ] [Former]
TARS00ITA (Taranto,ITA) [ ] [Former]
TEOS00ITA (Teramo,ITA) [ RNX3 ]
TER200UKR (Ternopil,UKR) [ RNX3 ]
TERC00PRT (Angra do Heroismo,PRT) [ RNX3 ]
TERS00NLD (West-Terschelling,NLD) [ RNX3 ]
TERU00ESP (Teruel,ESP) [ RNX3 ]
THU100GRL (Thule,GRL) [ ] [Former]
THU200GRL (Thule Airbase,GRL) [ RNX3 ]
THU300GRL (Thule Airbase,GRL) [ ] [Former]
TIT200DEU (Titz,DEU) [ RNX3 ]
TLL100IRL (Dublin,IRL) [ RNX3 ]
TLLG00IRL (Dublin,IRL) [ ] [Former]
TLMF00FRA (Toulouse,FRA) [ RNX3 ]
TLSE00FRA (Toulouse,FRA) [ RNX3 ]
TLSG00FRA (Toulouse,FRA) [ RNX3 ]
TOIL00EST (Toila,EST) [ RNX3 ]
TOPP00ITA (Toppo di Castelgrande,ITA) [ RNX3 ]
TOR100ESP (TORREJON DE ARDOZ,ESP) [ RNX3 ]
TOR200EST (Tõravere,EST) [ ] [Former]
TOR300EST (Tõravere,EST) [ RNX3 ]
TORA00EST (Travere,EST) [ ] [Former]
TORI00ITA (Torino,ITA) [ RNX3 ]
TORN00FIN (Tornio,FIN) [ RNX3 ]
TOUL00FRA (Toulouse,FRA) [ ] [Former]
TRAB00TUR (Trabzon,TUR) [ ] [Former]
TRDS00NOR (Trondheim,NOR) [ RNX3 ]
TREU00ITA (Trento,ITA) [ RNX3 ]
TRF200AUT (Pernitz,AUT) [ RNX3 ]
TRFB00AUT (Pernitz,AUT) [ ] [Former]
TRMI00ITA (Termoli,ITA) [ RNX3 ]
TRO100NOR (Tromsoe,NOR) [ RNX3 ]
TROM00NOR (Tromsoe,NOR) [ ] [Former]
TRON00NOR (Trondheim,NOR) [ ] [Former]
TUBI00TUR (Gebze,TUR) [ ]
TUBO00CZE (Brno,CZE) [ RNX3 ]
TUC200GRC (Chania,GRC) [ RNX3 ]
TUO200FIN (Kaarina,FIN) [ RNX3 ]
UBEN00ITA (Benevento,ITA) [ RNX3 ]
UCAG00ITA (Cagliari,ITA) [ RNX3 ]
UME600SWE (Umea,SWE) [ RNX3 ]
UNPG00ITA (Perugia,ITA) [ RNX3 ]
UNTR00ITA (Terni,ITA) [ RNX3 ]
UPAD00ITA (Padova,ITA) [ ] [Former]
USAL00ITA (Lecce,ITA) [ RNX3 ]
USDL00POL (Ustrzyki Dolne,POL) [ RNX3 ]
UZHL00UKR (Uzhgorod,UKR) [ RNX3 ]
VAA200FIN (Vaasa,FIN) [ RNX3 ]
VAAS00FIN (Vaasa,FIN) [ RNX3 ]
VACO00CZE (Vacov,CZE) [ ]
VAE600SWE (Vanersborg,SWE) [ RNX3 ]
VAIN00LVA (Vainode,LVA) [ RNX3 ]
VALA00ESP (Valladolid,ESP) [ RNX3 ]
VALE00ESP (Valencia,ESP) [ RNX3 ]
VARD00NOR (Vardoe,NOR) [ ] [Former]
VARS00NOR (Vardoe,NOR) [ RNX3 ]
VEN100ITA (Venezia,ITA) [ RNX3 ]
VENE00ITA (Venezia,ITA) [ ] [Former]
VFCH00FRA (Villefranche-sur-Cher,FRA) [ RNX3 ]
VIGI00ITA (Viggiano,ITA) [ RNX3 ]
VIGN00ITA (Vigna di Valle,ITA) [ RNX3 ]
VIGO00ESP (Vigo,ESP) [ RNX3 ]
VIL000SWE (Vilhelmina,SWE) [ RNX3 ]
VIL600SWE (Vilhelmina,SWE) [ RNX3 ]
VILL00ESP (Villafranca,ESP) [ RNX3 ]
VIR200FIN (Virolahti,FIN) [ RNX3 ]
VIRG00ITA (Cascina,ITA) [ RNX3 ]
VIS000SWE (Visby,SWE) [ RNX3 ]
VIS600SWE (Visby,SWE) [ RNX3 ]
VITR00BLR (Vitebsk,BLR) [ RNX3 ]
VLFR00ITA (Villafranca di Verona,ITA) [ RNX3 ]
VLIS00NLD (Vlissingen,NLD) [ RNX3 ]
VLN100IRL (Valentia,IRL) [ RNX3 ]
VLNS00LTU (Vilnius,LTU) [ RNX3 ]
VNRS00UKR (Vinnytsia,UKR) [ RNX2 ] [Former]
VTRB00ITA (Viterbo,ITA) [ RNX3 ]
WARE00BEL (Waremme,BEL) [ RNX3 ]
WARN00DEU (Rostock-Warnemuende,DEU) [ RNX3 ]
WETT00DEU (Koetzting,DEU) [ ] [Former]
WRLG00DEU (Bad Koetzting,DEU) [ RNX3 ]
WROC00POL (Wroclaw,POL) [ RNX3 ]
WSRT00NLD (Westerbork,NLD) [ RNX3 ]
WTZA00DEU (Bad Koetzting,DEU) [ RNX2 RNX3 ]
WTZR00DEU (Bad Koetzting,DEU) [ RNX3 ]
WTZS00DEU (Bad Koetzting,DEU) [ RNX3 ]
WTZZ00DEU (Bad Koetzting,DEU) [ RNX3 ]
WUTH00NOR (Polish Polar Station, Hornsund,NOR) [ RNX3 ]
YEBE00ESP (Yebes,ESP) [ RNX3 ]
YLDZ00TUR (Istanbul,TUR) [ ] [Proposed]
ZADA00HRV (Zadar,HRV) [ RNX3 ]
ZARA00ESP (Zaragoza,ESP) [ RNX3 ]
ZECK00RUS (Zelenchukskaya,RUS) [ RNX3 ]
ZIM200CHE (Zimmerwald,CHE) [ RNX2 RNX3 ]
ZIMM00CHE (Zimmerwald,CHE) [ RNX2 RNX3 ]
ZOUF00ITA (Cercivento,ITA) [ RNX2 RNX3 ]
ZPRS00UKR (Zaporizhzhia,UKR) [ ] [Former]
ZWEN00RUS (Zwenigorod,RUS) [ ] [Former]
ZYWI00POL (Zywiec,POL) [ RNX3 ]
ZZON00HUN (Zalaegerszeg,HUN) [ RNX3 ]
Select a month:
11-2024
10-2024
09-2024
08-2024
07-2024
06-2024
05-2024
04-2024
03-2024
02-2024
01-2024
12-2023
11-2023
10-2023
09-2023
08-2023
07-2023
06-2023
05-2023
04-2023
03-2023
02-2023
01-2023
12-2022
11-2022
10-2022
09-2022
08-2022
07-2022
06-2022
05-2022
04-2022
03-2022
02-2022
01-2022
12-2021
11-2021
10-2021
09-2021
08-2021
07-2021
06-2021
05-2021
04-2021
03-2021
02-2021
01-2021
12-2020
11-2020
10-2020
09-2020
08-2020
07-2020
06-2020
05-2020
04-2020
03-2020
02-2020
01-2020
12-2019
11-2019
10-2019
09-2019
08-2019
07-2019
06-2019
05-2019
04-2019
03-2019
02-2019
01-2019
12-2018
11-2018
10-2018
09-2018
08-2018
07-2018
06-2018
05-2018
04-2018
03-2018
02-2018
01-2018
12-2017
11-2017
10-2017
09-2017
08-2017
07-2017
06-2017
05-2017
04-2017
03-2017
02-2017
01-2017
12-2016
11-2016
10-2016
09-2016
08-2016
07-2016
06-2016
05-2016
04-2016
03-2016
02-2016
01-2016
12-2015
11-2015
10-2015
09-2015
08-2015
07-2015
06-2015
05-2015
04-2015
03-2015
02-2015
01-2015
12-2014
11-2014
10-2014
09-2014
08-2014
07-2014
06-2014
05-2014
04-2014
03-2014
02-2014
01-2014
12-2013
11-2013
10-2013
09-2013
08-2013
07-2013
06-2013
05-2013
04-2013
03-2013
02-2013
01-2013
12-2012
11-2012
10-2012
09-2012
08-2012
07-2012
06-2012
05-2012
04-2012
03-2012
02-2012
01-2012
12-2011
11-2011
10-2011
09-2011
08-2011
07-2011
06-2011
05-2011
04-2011
03-2011
02-2011
01-2011
12-2010
11-2010
10-2010
09-2010
08-2010
07-2010
06-2010
05-2010
04-2010
03-2010
02-2010
01-2010
12-2009
11-2009
10-2009
09-2009
08-2009
07-2009
06-2009
05-2009
04-2009
03-2009
02-2009
01-2009
12-2008
11-2008
10-2008
09-2008
08-2008
07-2008
06-2008
05-2008
04-2008
03-2008
02-2008
01-2008
12-2007
11-2007
10-2007
09-2007
08-2007
07-2007
06-2007
05-2007
04-2007
03-2007
02-2007
01-2007
12-2006
11-2006
10-2006
09-2006
08-2006
07-2006
06-2006
05-2006
04-2006
03-2006
02-2006
01-2006
12-2005
11-2005
10-2005
09-2005
08-2005
